Step 1
Set the air temperature
0°C
Choose °C or °F. Switching units preserves the entered physical value.
Use temperature and wind from the same place and observation time.
Use temperature and wind from the same place and observation time.
0°C
Choose °C or °F. Switching units preserves the entered physical value.
20 km/h
Choose km/h, mph, m/s or knots. Use representative wind, not just the strongest gust.
−5.2°C
The result is wind chill only at 50°F or below and above 3 mph; otherwise the panel shows air temperature.
For a winter commute, start with the forecast for the time you will actually be walking or waiting. At 0°C, compare 10 km/h on one leg with 20 km/h on an exposed bridge: about −3.3°C versus −5.2°C wind chill. This helps distinguish a colder-feeling section from a colder air mass.
A sheltered stop may be a more useful change than choosing a route with the same wind exposure a few minutes later. Treat the two wind speeds as scenarios unless you have local observations; the calculator does not know the shelter along your route.
For an outdoor task, pair the shift's temperature with sustained wind from the same forecast hour. Keep one setup for the exposed work area and another for the sheltered staging area. Export the readings and method so everyone can see what was compared, rather than passing around an unexplained feels-like number.
The estimate does not select clothing, rest intervals or an exposure duration. A wet task or work at height can differ from the standard observation. Use the comparison to identify the conditions that need checking under the site's established procedures.
For a weather lesson, leave air temperature at 0°C and change only wind: 10, 20, then 40 km/h. Ask learners to predict the second change before calculating it. The difference grows, but not in direct proportion to wind speed.
Return the wind to 20 km/h, then switch km/h to m/s and Celsius to Fahrenheit without retyping the numbers. The physical setup is unchanged. This separates three concepts that are easily confused: a changed condition, a changed unit and a display rounded to one decimal place.
Enter measured air temperature, not a weather app's feels-like temperature. Putting an already adjusted value into the temperature box applies a second adjustment. Use sustained wind from the same place and time; a day's coldest temperature and its strongest afternoon gust are not necessarily conditions anyone experienced together.
A forecast station describes its surroundings, not every street corner. Buildings, trees and ridges change exposure. For an uncertain route, run two clearly labelled scenarios rather than inventing a precise sheltered wind. Keep the temperature fixed if your question is about shelter; change both readings only when you are comparing different forecast hours.
The NWS model already relates standard-height wind observations to facial-level conditions. Do not reduce a station's wind by a guessed height factor and then describe the result as the standard index. A handheld measurement beside a wall can be useful local context, but it is not automatically interchangeable with a representative weather-station wind. NWS explanation of the wind measurement and facial model.
The modern index describes heat transfer, not a hidden second thermometer reading. Airflow disrupts the warmed layer next to exposed skin. That distinction matters when comparing a windy street with a sheltered stop: the index changes while the measured air temperature can stay the same.
The NWS introduced its revised index on November 1, 2001. Its model relates standard-height wind observations to conditions near an adult face and assumes no solar warming. This is why entering a forecast wind is useful, but adding a guessed sunshine correction or treating it as a skin-temperature measurement is not.
The official change notice explains the move to a consistent facial model and a lower calm-wind threshold. Clothing, wetness and an individual’s physiology remain outside these two inputs. NWS notice introducing the 2001 index.
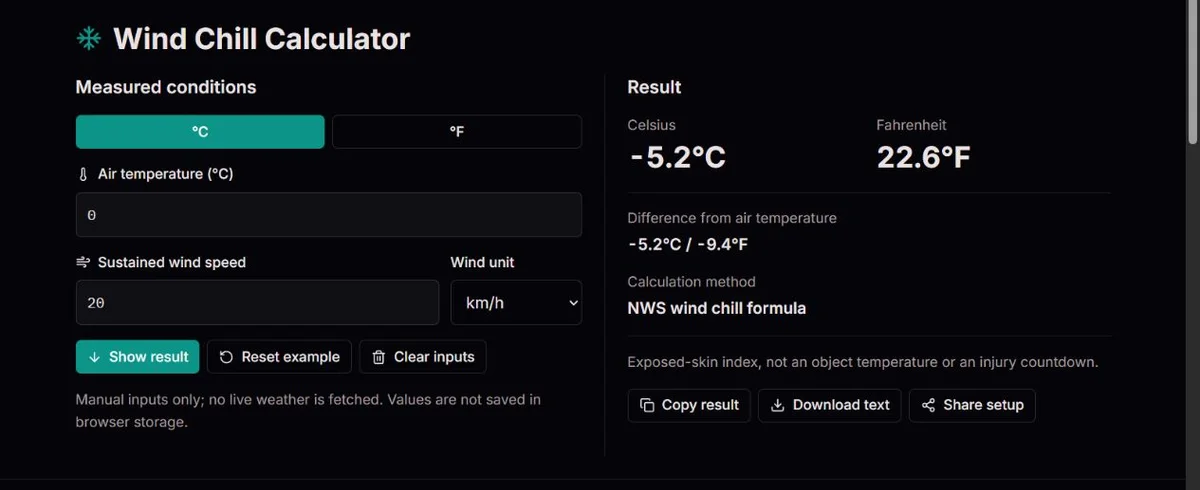
At 0°C and 20 km/h, the NWS equation gives about −5.2°C. The difference is about −5.2°C, or −9.4°F: temperature differences use a scale factor, not the 32-degree offset used to convert an actual temperature.
At exactly 3 mph, the standard formula is not defined. This tool shows the air temperature and a range message instead of labelling that fallback as wind chill. A pipe does not become colder than the air simply because this index is lower. NWS equation, boundaries and object-temperature explanation.
The fixed comparison below changes wind alone. Moving from 10 to 20 km/h lowers the index by about 1.9°C; moving from 20 to 40 km/h lowers it by about another 2.2°C. Neither doubling makes the original gap double. The fractional power V^0.16 in the equation is one reason a straight-line mental rule is misleading.
Read the difference as index minus air temperature, not a second air reading. At 0°C and 20 km/h, a −5.2°C difference means the exposed-skin estimate is 5.2 Celsius degrees lower. On the Fahrenheit scale that gap is about −9.4°F, not 22.6°F. Only an actual temperature conversion adds 32.
The equivalent wind speeds for 20 km/h are about 12.43 mph, 5.56 m/s and 10.80 knots. Switching the selector converts the existing value. If you type 20 again after switching to mph, you have chosen a stronger wind, not another way of displaying the same setup.
| Wind | Wind chill | Difference from air |
|---|---|---|
| 10 km/h | −3.3°C | −3.3°C |
| 20 km/h | −5.2°C | −5.2°C |
| 40 km/h | −7.4°C | −7.4°C |
Rounded engine examples, not live readings or a prediction for a particular person.
If the panel shows air temperature, first check the domain rather than the arithmetic. Exactly 50°F (10°C) is included, but exactly 3 mph is not; 3 mph is 4.828032 km/h. A displayed rounded value near that boundary can hide which side the original input occupies. The tool makes the decision before display rounding.
Blank fields are not zero. Enter numbers without a unit suffix; use the selectors for units. Clear inputs removes the current readings, while Reset example restores the demonstration rather than retrieving weather for your location. Show result takes you to the result panel; changing a value already updates the calculation.
Copy result gives a readable report, Download text provides a file, and Share setup creates a link with the inputs and units. A link is a reproducible scenario, not a forecast that updates itself. Add the observation time and source separately if the comparison will be reused. Inputs are not saved in browser storage, so retain a report or setup link before leaving when the values matter.
When another calculator disagrees, compare the actual air temperature, sustained wind, units and formula first. Some services use a different apparent-temperature model, and whole-degree charts discard detail. Matching the model and inputs is more informative than arguing over the final decimal.
Inputs convert to Fahrenheit and mph before the NWS equation is evaluated. The domain check uses unrounded values; both output scales and differences are rounded only for display. This tool accepts −80 to 60°C and 0 to 150 mph; that input box is not an accuracy guarantee throughout the range.
WCT = 35.74 + 0.6215T − 35.75V^0.16 + 0.4275TV^0.16; T[°F], V[mph]
The index applies at or below 50°F with wind above 3 mph and assumes no solar warming. It does not measure body temperature, predict a personal injury time or certify safe exposure. Terrain, shelter, wet clothing and changing wind matter; follow official local guidance.
Testing methodologyFor a discrepancy, include temperature, wind, both units, observation time and a reference calculation. Compare unrounded inputs and sustained wind first. Do not send private location details unless needed.
Corrections policyWind alone speeds cooling toward the surrounding air temperature; it does not cool an object below it. Wind chill is an exposed-skin index, not a pipe-temperature forecast.
The NWS definition requires air at or below 50°F and wind above 3 mph. Outside it, the panel explicitly shows air temperature rather than a standard wind chill.
Use sustained wind for the representative calculation. A gust can be entered as a separate, labelled scenario to see the effect of a stronger wind, but it should not replace the sustained reading without explanation. The page does not average a series of gusts or model how long each lasts.
No: enter its measured or forecast air temperature instead. Feels-like may already include wind, humidity or another model. Using it as the input compounds adjustments. If the app's result differs, look for its index definition and compare the same observation time before assuming either calculation is wrong.
This equation assumes no solar warming and has no sun control. Do not add an arbitrary number to make a sunny forecast fit. Compare shade and shelter on the actual route, and keep the displayed standard estimate separate from your description of the conditions.
Cold discomfort extends beyond the index's defined range. Above 10°C or at wind of 3 mph or less, this tool labels the output as air temperature. That is a model boundary, not a statement that the conditions are comfortable or that precautions are unnecessary.
A converted value may contain more digits than the display. Replacing 12.4274 mph with 12 mph changes the wind, and can change the result or a boundary decision. Leave the converted field intact for an equivalent-unit comparison; round only the report if that level of detail is unnecessary.
There is no clothing or movement setting. Bicycle speed plus reported wind is not generally the airflow at your face: wind direction matters too. Use the standard index for weather context, not as a personalized model of a rider, covered skin or protective equipment.